

Data plotting tool
Data plotting
Data plotting is visualization of large amount of data in various formats so that the data can be viewed intuitively by using graphs and diagrams. In order to make easier to understand data characteristics and trends while analyzing big data measured by IoT, it is necessary to effectively use various types of graphs and diagrams according to the purpose and type of data
Solution
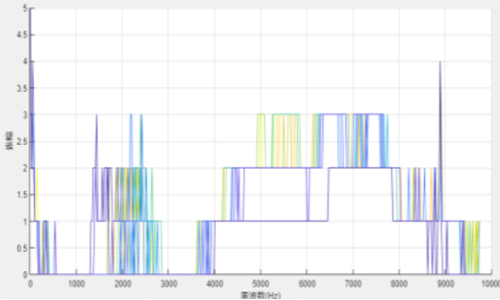
Data plotting with MATLAB App Designer
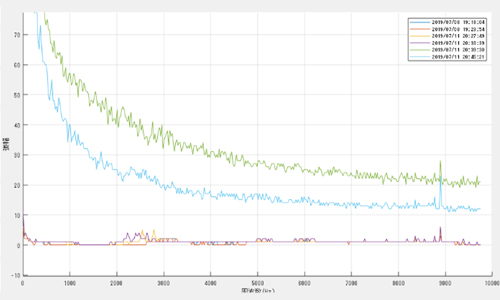
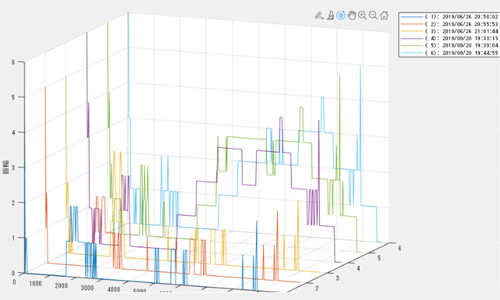
Various data is visualized using the Design Tool called App Designer attached to MATLAB.We build the plot screen (line, data distribution, discrete data, polar coordinates, Surf/Mesh, Image etc.) and data plot application that can be represented by MATLAB to match customer ‘s data structure.In addition to data plotting, we also accept application development using App Designer and application distribution using MATLAB Compiler.
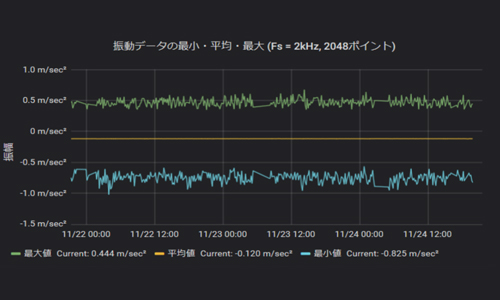
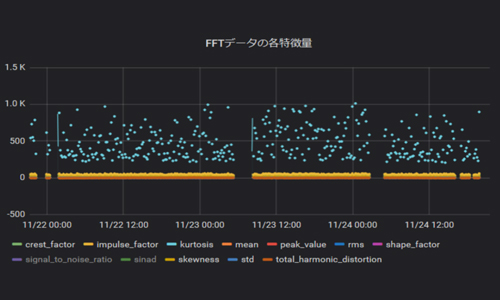
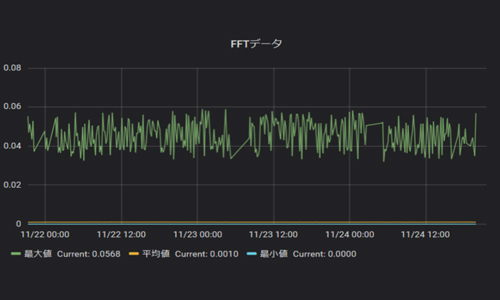
Data plotting with Grafana
Data visualization using ”Grafana” from Grafana Labs, derived from Elasticsearch’s data visualization dashboard “Kibana”.Grafana can connect to various databases and is not limited to Elasticsearch, hence can connect to customer’s choice of database source.We respond to various requests such as panel design according to data source, dashboard construction, alert/notification settings, etc.